Are values monotonic? Always increasing, decreasing, or unvarying?
Source:R/monotonics.R
monotonic.RdThese provides three families of functions to tell you if values are always
increasing, decreasing, or unvarying, with the functions, increasing(),
decreasing(), or unvarying(). Under the hood it uses diff to find
differences, so if you like you can pass extra arguments to diff.
Examples
vec_inc <- c(1:10)
vec_dec<- c(10:1)
vec_ran <- c(sample(1:10))
vec_flat <- rep.int(1,10)
increasing(vec_inc)
#> [1] TRUE
increasing(vec_dec)
#> [1] FALSE
increasing(vec_ran)
#> [1] FALSE
increasing(vec_flat)
#> [1] FALSE
decreasing(vec_inc)
#> [1] FALSE
decreasing(vec_dec)
#> [1] TRUE
decreasing(vec_ran)
#> [1] FALSE
decreasing(vec_flat)
#> [1] FALSE
unvarying(vec_inc)
#> [1] FALSE
unvarying(vec_dec)
#> [1] FALSE
unvarying(vec_ran)
#> [1] FALSE
unvarying(vec_flat)
#> [1] TRUE
library(ggplot2)
library(gghighlight)
library(dplyr)
heights_mono <- heights %>%
features(height_cm, feat_monotonic) %>%
left_join(heights, by = "country")
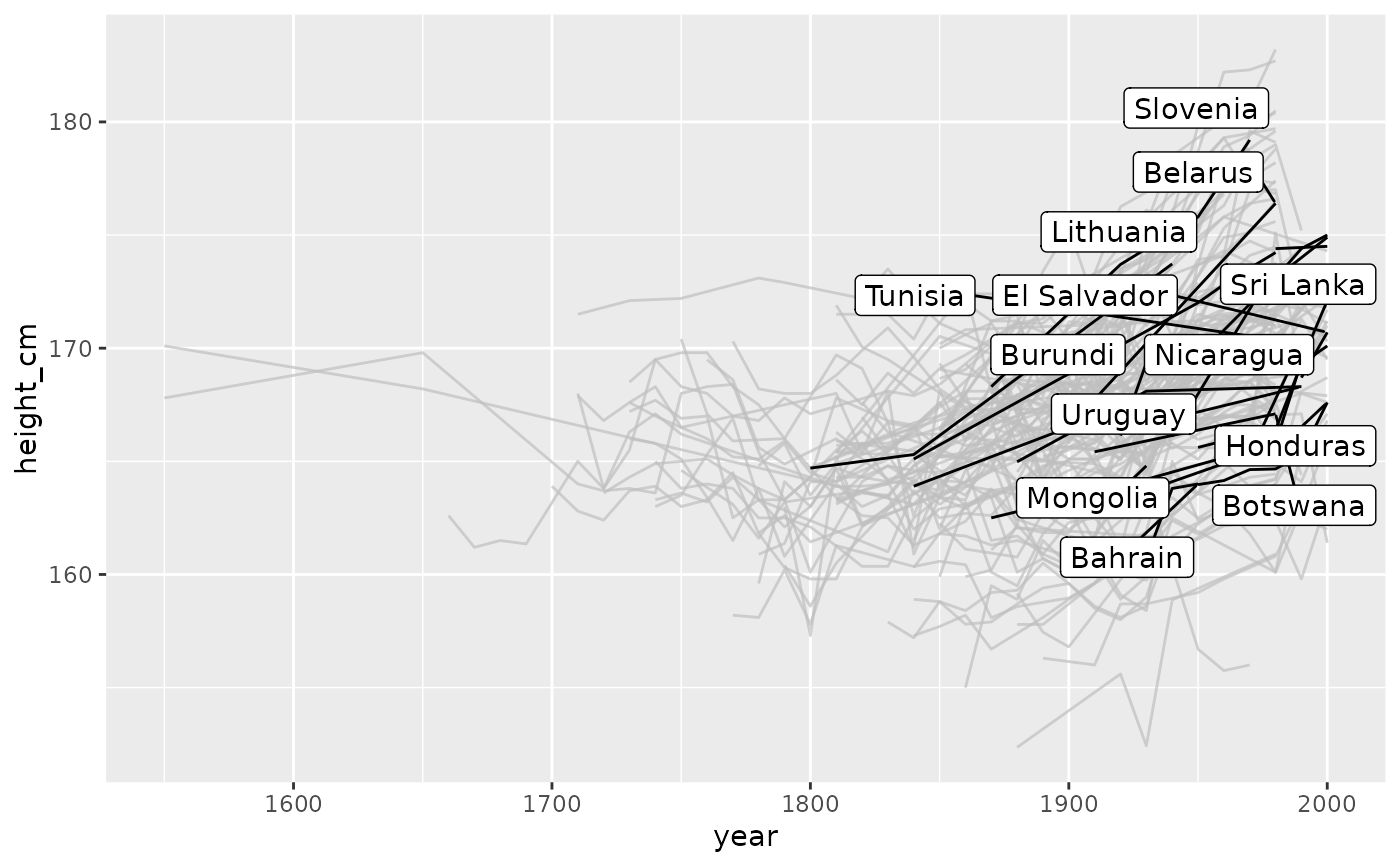
ggplot(heights_mono,
aes(x = year,
y = height_cm,
group = country)) +
geom_line() +
gghighlight(increase)
#> Warning: Tried to calculate with group_by(), but the calculation failed.
#> Falling back to ungrouped filter operation...
#> label_key: country
#> Warning: ggrepel: 1 unlabeled data points (too many overlaps). Consider increasing max.overlaps
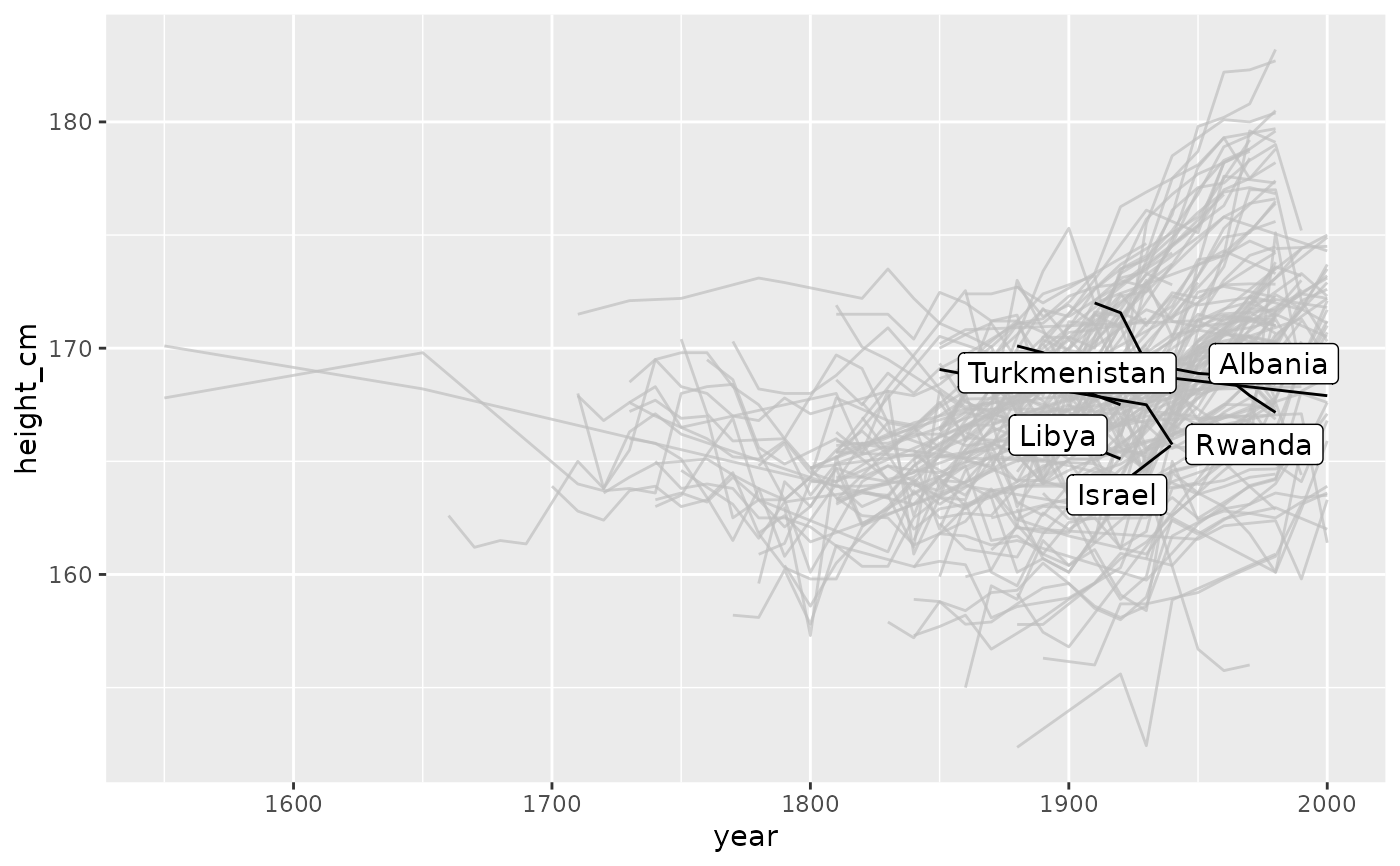
 ggplot(heights_mono,
aes(x = year,
y = height_cm,
group = country)) +
geom_line() +
gghighlight(decrease)
#> Warning: Tried to calculate with group_by(), but the calculation failed.
#> Falling back to ungrouped filter operation...
#> label_key: country
ggplot(heights_mono,
aes(x = year,
y = height_cm,
group = country)) +
geom_line() +
gghighlight(decrease)
#> Warning: Tried to calculate with group_by(), but the calculation failed.
#> Falling back to ungrouped filter operation...
#> label_key: country
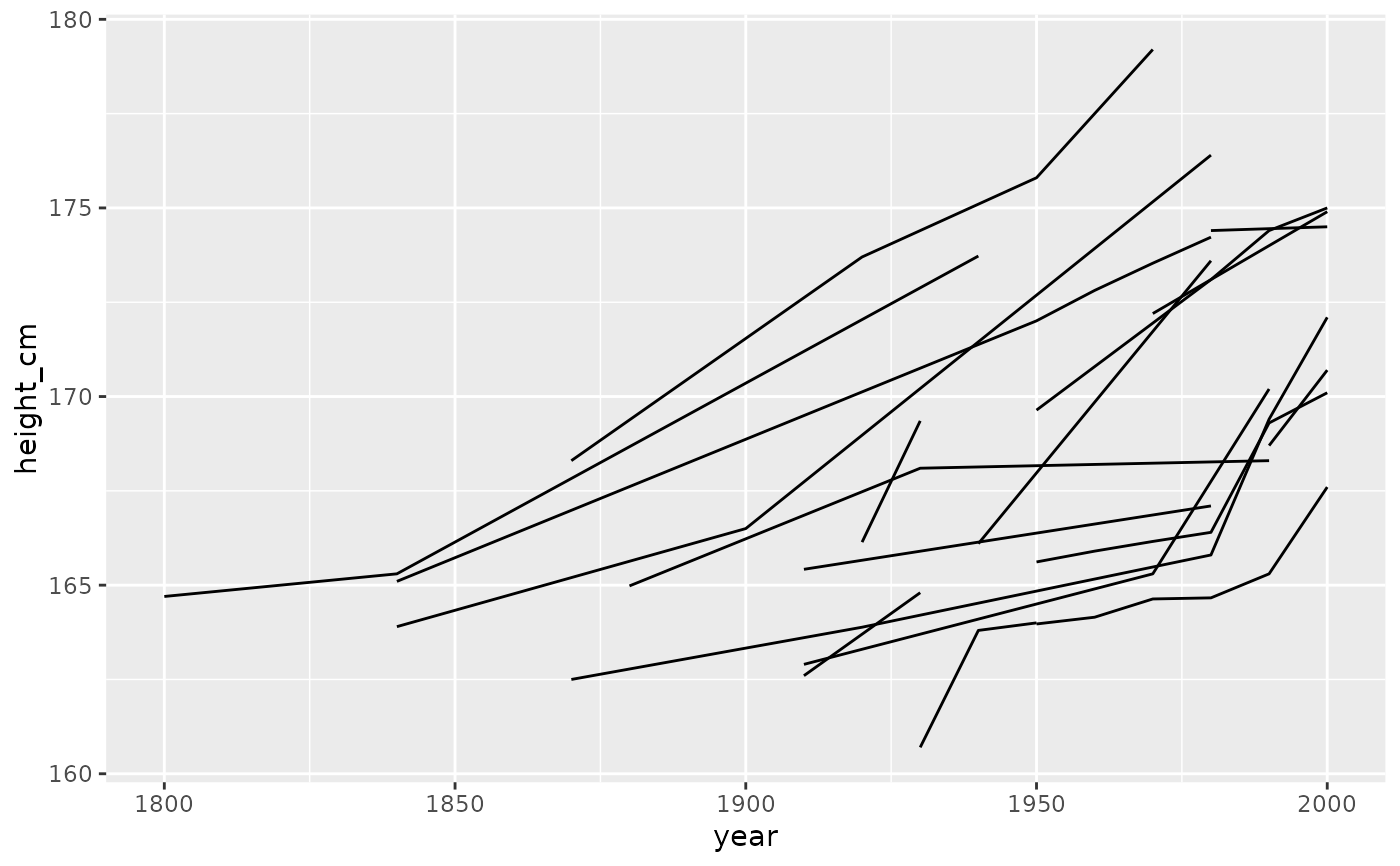
 heights_mono %>%
filter(monotonic) %>%
ggplot(aes(x = year,
y = height_cm,
group = country)) +
geom_line()
heights_mono %>%
filter(monotonic) %>%
ggplot(aes(x = year,
y = height_cm,
group = country)) +
geom_line()
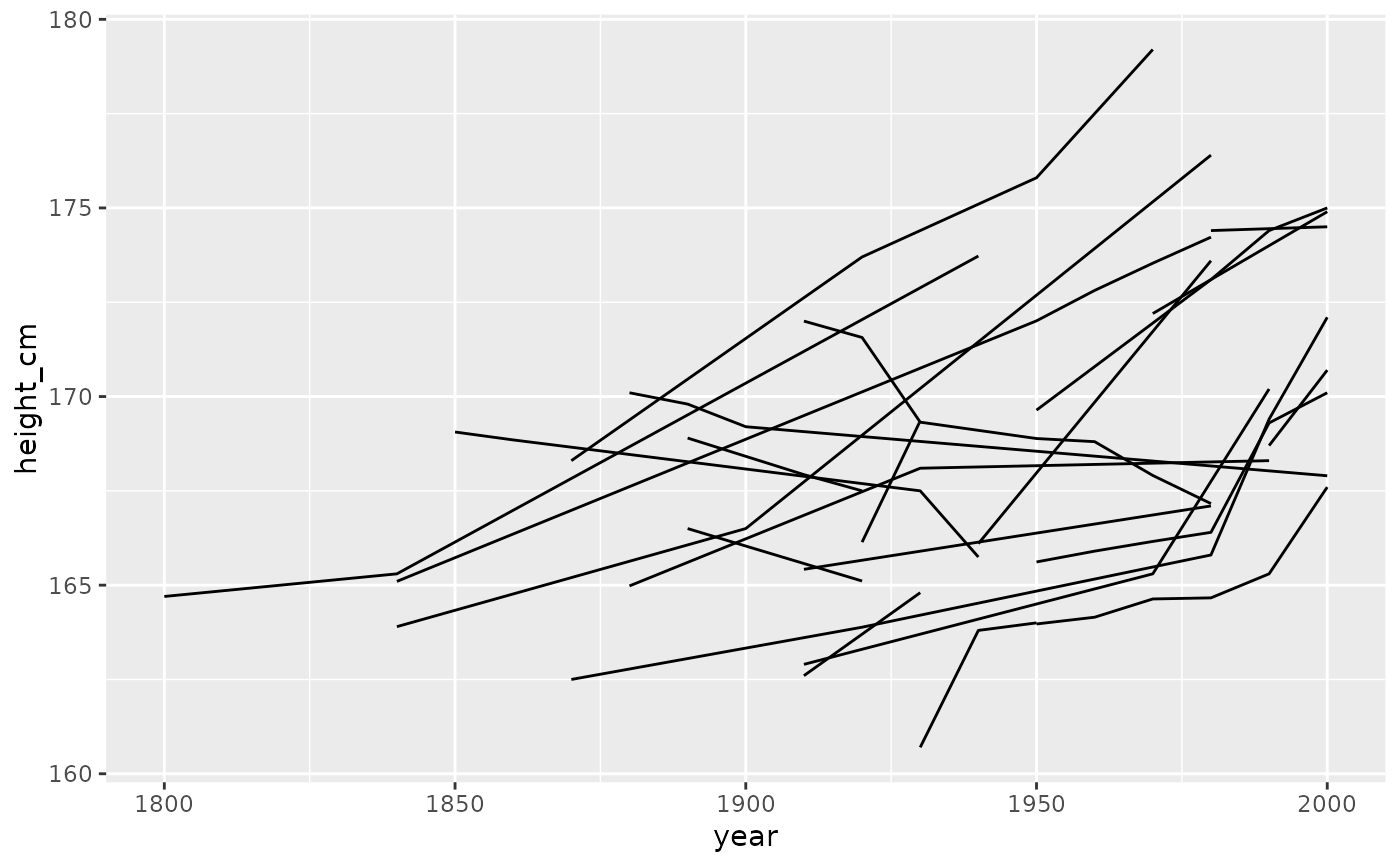 heights_mono %>%
filter(increase) %>%
ggplot(aes(x = year,
y = height_cm,
group = country)) +
geom_line()
heights_mono %>%
filter(increase) %>%
ggplot(aes(x = year,
y = height_cm,
group = country)) +
geom_line()